Overview screen
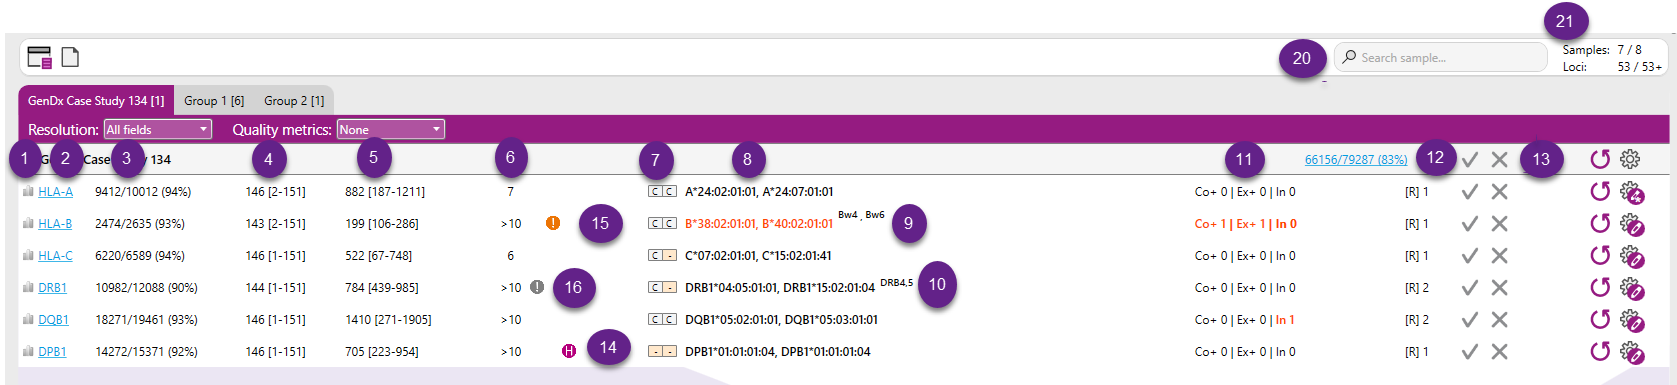
When the data file has been analyzed, the overview screen will look like this:
In this screen the following buttons are visible at the top:
- Overview: Jump directly back to the overview screen from any other window.
- Reports: Reporting center to create pdf lab reports.
Directly below the purple header, file names are indicated in bold letters. The filename can be preceded by "P" indicating that the data is paired-end data, or "J" indicating that two files are jointly analyzed. Also the combination "JP" is possible, when paired end files are joined.
The blue, underlined numbers behind the file name indicate the percentage mappability: 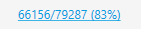 This is the total number (66156 out of 79287) and percentage (83%) of reads that could be assigned to one of the loci.
Clicking it will open a new window with more detailed information on the read counts.
Below the sample name, a table is presented with the typing results. Column headers are presented when hovering over each of the columns.
See also the purpe numbers in the picture above:
1. Base variation: Hovering over the icon displays the base variation graph that is also plotted in the sample statistics tab.
2. Locus: the HLA locus present in the data file as determined by NGSengine or set by the user
3. Mappability: aaaa/bbbb (cc%), where:
- bbbb is the total number of reads in the file assigned to this locus
- aaaa is the total number of reads that could be aligned to the reference
- cc is the percentage of reads that could be aligned to the reference
4. Read length: ddd [ee-fff], where:
- ddd is the average read length of the reads from this gene.
- ee is the minimum read length of the reads from this gene.
- fff is the maximum read length of the reads from this gene.
5. Read depth: (gggg, hhhh), where:
- gggg is the median read depth
- hhhh is the maximum read depth
6. Matching: Total number of best matching genotypes.
7. CWD status of matching alleles.
8. Best match: Best matching genotype. In case there is more than 1 best matching genotype, the complete list can be found in the alignment view in the tab Genotype ranking.
When the core region of a locus is not (completely) covered or positions are undefined (question marks or ignored positions) then there will be no typing result, but a warning will be shown: Insufficient data.
Insufficient data is shown when:
- Class I: Over 10 undefined positions are present in Exon 2 and Exon 3 combined.
- Class II: Over 5 undefined positions are present in Exon 2.
- Core+ region is covered by less than 20 reads.

9. Bw4 and Bw6 status of HLA-B typing results.
10. Associations between DRB1 typing and expected presence of DRB3/4/5. This can be toggled on or off in the Preferences.
11. Mismatch level:
- The number after [Co] indicates the number of core exon mismatches between the data and the best matching genotype(s)
- The number after [Ex] indicates the number of all exon mismatches between the data and the best matching genotype(s)
- The number after [In] indictes the number of intron mismatches between the data and the best matching genotype(s)
Insertions and deletions are displayed as mismatches.
12. Number of phased regions: The number of phased regions present in the gene. If [R] is 1, this means that all heterozygous positions were phased together.
When a genotype ambifguty is observed in the data due to the break in phasing, the below broken chain symbol is indicated next to thte number of phased regions.

13. Status: Shows the status of the approval of this data file. A detailed explanation of the Approval of data can be found in Sample Approval.
14. Homozygous: An "H" before the typing result indicates that the typing is homozygous.
15. Exclamation point: An exclamation point before the typing result indicates a warning. This can indicate a DRB warning because of missing or unexpected DRB345 data or missing DRB1 data.
Hovering over the exclamation point will show the nature of the warning
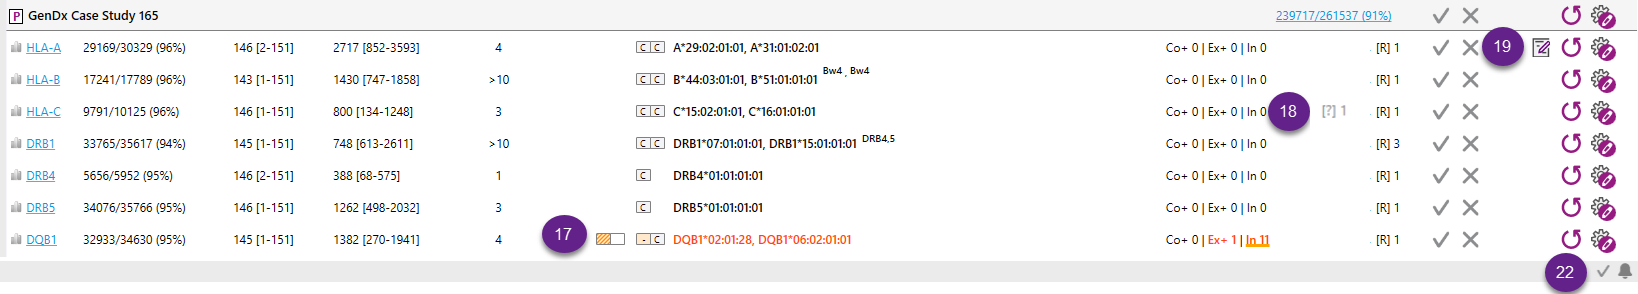
16. When exon or intron data is missing from the IMGT/HLA database, NGSengine uses data from another allele in the same allele group. The extrapolation indicator shows whether extrapolation has been used. In addition, when there is a mismatch with this extrapolated data, the mismatch display next to the typing result for [Ex]1 or [In]1 is underlined.
17. Question marks: Indicates the number of question marks in the phased region(s). A question mark indicates a position where NGSengine cannot determine if that position is heterozygous or homozygous.
The question marks in the Overview screen are colored according to their positions:
- Red: there is at least one question mark in the Core+ region
- Black: there is at least one question mark in an Exons+ region outside a core region
- Grey: there are only question marks in introns or UTRs

18. It is possible to add comments to a sample or a locus and these can be shown on the PDF report. More info can be found in Sample and locus management.
19. Filter: It is possible to filter the samples that are displayed by typing part of the sample name in the filter box. This is particularly useful when you are searching for a specific sample in a large data set.
20. Counter: Counts the number of samples and loci that have been analyzed in the open project.
21. Information about errors can be viewed here. This is only for errors that do not need immediate user interaction.
When the data has been analyzed, the name of the HLA locus will turn from black to blue. When it is blue, you can evaluate the results of the analysis by clicking on the locus name. The data will be presented in the Analysis Screen.
Samples can be organized into groups, for a separate analysis and/or an improved overview. How to make groups is described in Sample and locus management.
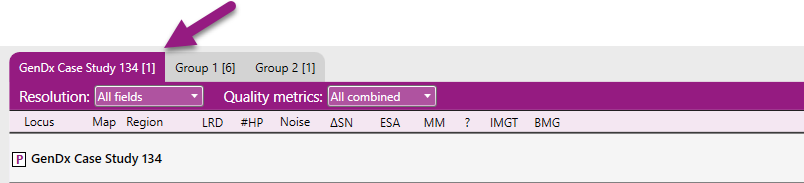
When a group has been made, it will be shown with a tab with the group name on the Overview screen:
When the samples have been organized in groups, the "Analyze" button on the left of the screen will change to "Analyze group":
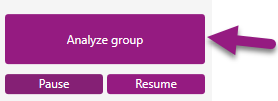
Clicking on this button will start analysis of only the samples in the group that is shown on the Overview screen.
The filtering option will still be applied to all samples, for all groups that have been made.
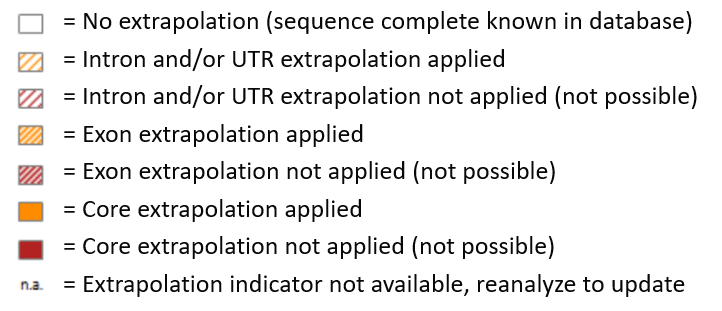
NGSengine uses information from IPD-IMGT/HLA, IPD-KIR, or other recognized databases as a reference for genotyping. Sometimes sequences in these databases are incomplete. In this case, NGSengine can use parts of another sequence within the same allele group as a reference. This strategy of extrapolation generally leads to a more accurate typing result compared to not using a reference for the incomplete sequences.
When extrapolation is applied, this is visible in the overview screen. The following indicators can be found.
When the View option "Show CWD info" (Common and Well-Documented Alleles information) for the Overview screen has been selected, the CWD status of the best match will be shown next to the typing result in the Overview screen:
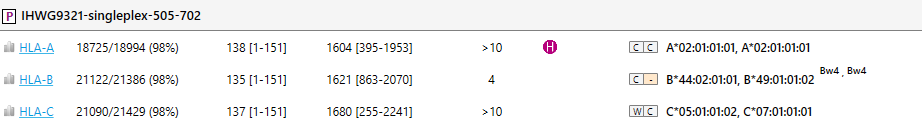
C = common
W = well-documented
- = not on the list
For assignment of the Bw4/ Bw6 status, the list as defined in “Complete IPD-IMGT/HLA Allele to UNOS antigen Equivalency Table” is used. This list, based on IPD-IMGT/HLA release 3.37.0, can be downloaded from https://www.transplanttoolbox.org
The Bw4/ Bw6 status can also be exported to the PDF and TARR export. Labs are advised to determine the concordancy of this method with their locally applied method to assign Bw4/ Bw6 status.
|
Epitope state |
Description |
|
Bw4 |
Allele is positive for Bw4 |
|
Bw6 |
Allele is positive for Bw6 |
|
Neg. |
Allele is negative for Bw4 and Bw6. This states applies to all null alleles |
|
? |
The list does contain the (two field) allele but the epitope state is unknown (NA assigned by ALLAN) |
|
n.a. |
The list does not contain the allele or the list was not available during analysis |
Reference: Kaur N, Kransdorf EP, Pando MJ, Maiers M, Ray B, Lee J-H, Lalli P, Murphey CL, Bray RA, Gragert L. Mapping molecular HLA typing data to UNOS equivalents. Human Immunology. 2018: doi.org/10.1016/j.humimm.2018.08.002
The purple header contains a dropdown menu in which the typing resolution can be selected:
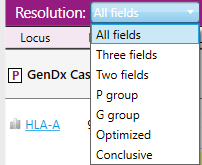
- All fields: Up to 4 fields are shown.
- Three fields: Only the first 3 fields are shown, even if a higher level of resolution was obtained.
- Two fields: Only the first 2 fields are shown, even if a higher level of resolution was obtained.
- P group: The typing result is shown in P groups.
- G group: The typing result is shown in G groups.
- Optimized: The typing result is shown at a resolution level with the lowest number of ambiguities for each of the two alleles. Both allele and genotype ambiguites will be optimized in this manner.
The optimized typing algorithm follows a certain hierarchy, which is defined by the user in the Preferences settings:
1. First 4 field, followed by 3 field, 2 field, P group and finally G group level, or
2. First 4 field, followed by 3 field, 2 field, G group and finally P group level
Via the Preferences settings, it can be defined that the minimal resolution level should be at least G group, P group, 2 field or 3 field. For example: when selecting 3 field, the optimized typing result will not condense to 2 field, P group or G group level.
Expression variants, mismatches, and P and G groups:
- Certain alleles have an expression character (for example N) which indicates that it is a null allele. Alleles with a certain expression will never be condensed. For example, if A*02:01:01:02L is present in a typing, it will not be grouped with other A*02:01 alleles but will always be reported as A*02:01:01:02L.
- The only exception to this rule are the G groups. Alleles with expression characters can be optimized in a G group.
- In case of mismatches (intron or exon) condensing will be applied to all ambiguities of the same mismatch level.
- In case an allele does not have a P or G group, the allele typing result will not be condensed and will keep its original resolution.
Special conditions apply to the optimization of genotype ambiguites:
- Genotype ambiguites are not condensed when there are Exon+ mismatches present.
- No intron mismatch information is reported when a genotype ambiguity is optimized to 3rd field resolution or lower.
Optimized typing can be applied for the following loci:
- HLA-A, B, C, G, E, F, H, J, K, L, P, T, U, V, W, X, Y
- DRB1, DRB2, DRB3, DRB4, DRB5, DRB6, DRB7, DRB8, DRB9
- DQB1, DQB2, DQB3
- DQA1, DQA2
- DPB1, DPB2
- DPA1, DPA2
- TAP1, TAP2
- Conclusive: The typing result is shown at a custom resolution level defined by the reviewer in the Preferences settings.
The selection that is made for the Resolution in this dropdown menu is only for what you see in the Overview screen. In the reports and in the export files, always all fields are shown. P group and G group info and the optimized typing result (at the resolution level that is selected in the Preferences settings) is automatically shown in the export files and this info can also be included in the Reports.
The purple header contains a dropdown menu in which the quality metrics can be selected:
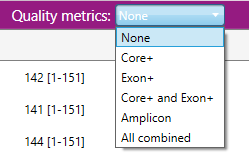
Separate quality thresholds can be viewed for the Locus mappability and per genetic region: Amplicon, Exon+ or Core+.
Quality threshold settings determine color coding of low, intermediate, and high quality. The thresholds can be set via preferences > quality thresholds.
When quality metrics have been selected, they are displayed in the overview screen:
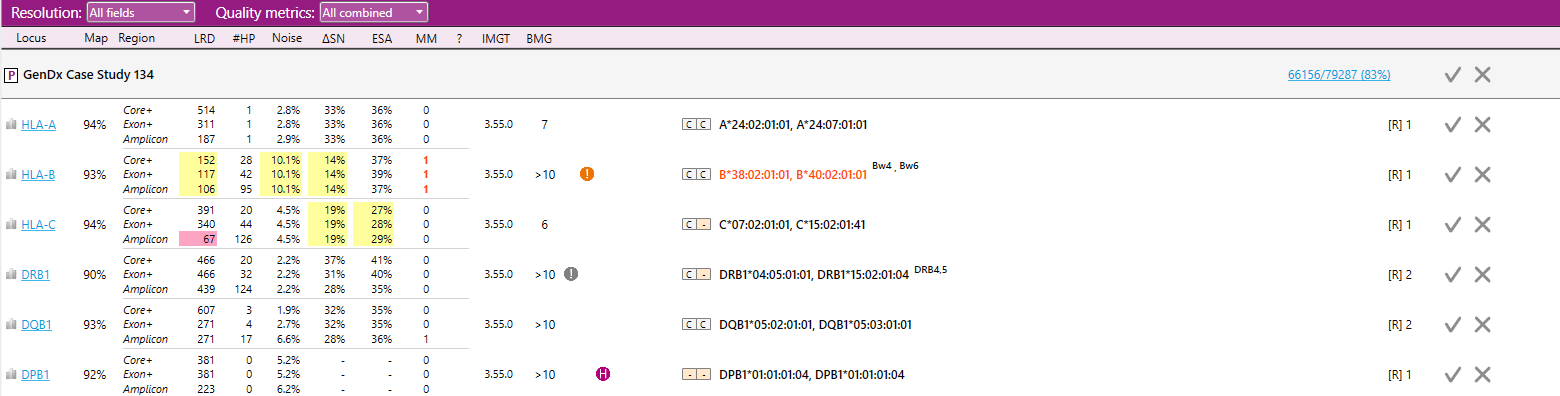
- Map Mappability: The locus mappability in percentage of reads that could be aligned to the reference.
- LRD Lowest read depth: The number of reads at the position with the lowest read depth.
- #HP Heterozyous positions: The number of heterozygous positions.
- Noise Maximum noise %: The percentage of noise at the position with the highest noise level. Noise means base call errors arisen during sequencing.
- ΔSN Delta signal to noise %: The difference between the highest noise position and the lowest heterozygous position in percentage.
- ESA Second allele %: The median percentage of the heterozygous positions of the allele with the lowest abundance.