Genotype ranking
This tab shows a ranking of matching genotypes.
The 'Resolution' button at the top can be used to select which typing resolution will be shown:
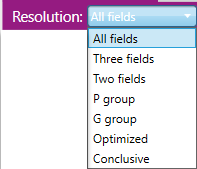
- All fields: Up to 4 fields are shown.
- Three fields: Only the first 3 fields are shown, even if a higher level of resolution was obtained.
- Two fields: Only the first 2 fields are shown, even if a higher level of resolution was obtained.
- P group: The typing result is shown in P groups.
- G group: The typing result is shown in G groups.
- Optimized: The typing result is shown at a resolution level with the least amount of ambiguities for each of the two alleles, with the minimal required resolution as defined in the Preferences settings.
- Conclusive: The typing result is shown at a custom resolution level defined by the reviewer in the Preferences settings.
A further explanation of the 'Optimized typing' feature is described in the Overview screen section, and can be found by clicking here.
It is possible to filter the listed allele ambiguities based on three criteria, ‘Best matching’, ‘Default’ and ‘Extended’.
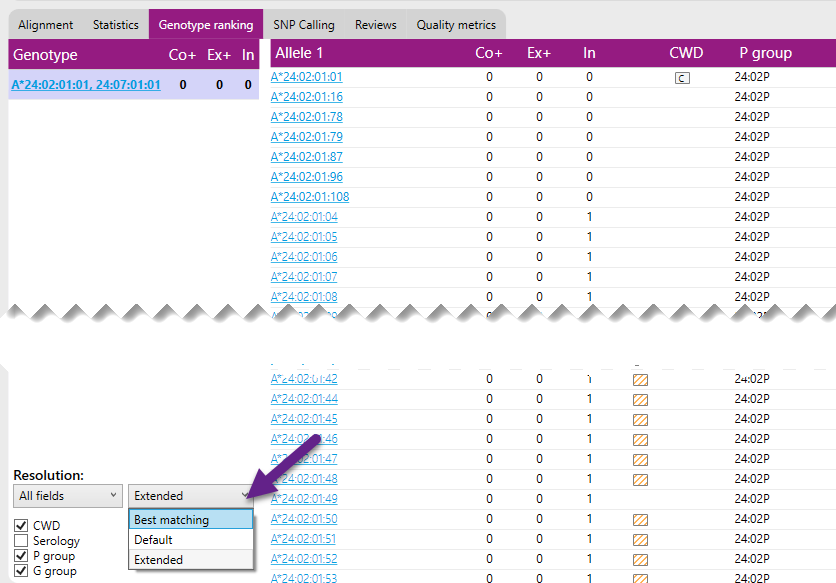
- Best matching: This option will show only the allele ambiguities that have the lowest number of mismatches.
- Default: This option will show all allele ambiguities with 1 additional Exon+ mismatch to the data compared to the best match of that allele.
- Extended: This option will show all allele ambiguities with up to 3 Core+ mismatches to the data compared to the best match of that allele.
The selection that is made here is only for what you see in the genotype ranking. In the reports and in the export files, always all fields are shown. P group and G group info and the optimized typing result (at the resolution level that is selected in the Preferences settings) is automatically shown in the export files and this info can also be included in the Reports.
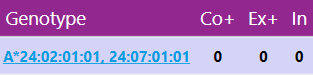
The 'Genotype' box on the left shows the best matching genotypes of the selected locus. The three numbers indicate the number of Core+ mismatches, Exon+ mismatches or Intron mismatches and the number of other matching genotypes with the same mismatch level.
Core+ (Co+) stands for priority regions: the core exons with their splice sites (exon 2+3 for Class 1 loci, exon 2 for Class 2 loci), plus the intron regions that enable correct identification of the presence or absence of particular null alleles. Exon+ (Ex+) stands for priority regions: all exons with their splice sites, plus the intron regions that enable correct identification of the presence or absence of particular null alleles.
Alternative matches are presented in a separate list for Allele 1 and Allele 2 next to the best match:
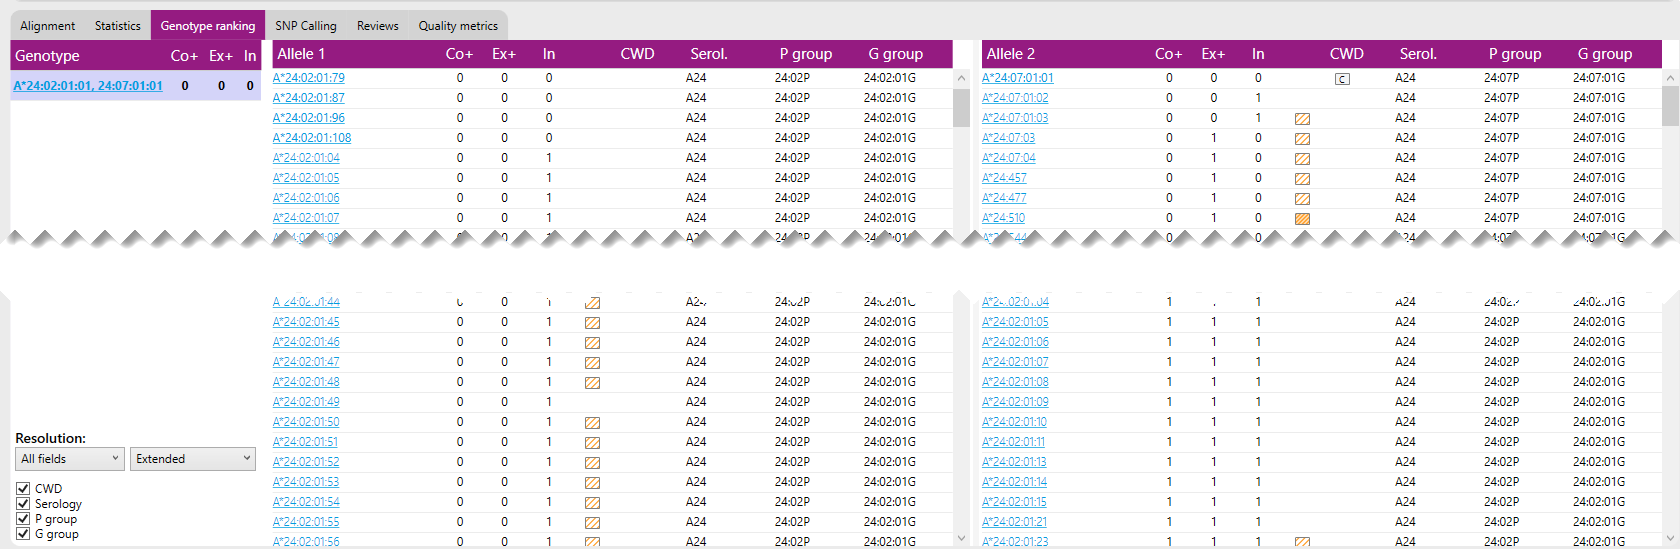
Any alternative allele with 0 or 1 exon mismatch is presented here. The number of mismatches between any combination of alleles and the data can be calculated.
For example: the combination of A*24:02:01:04 (0 0 1) and A*24:477 (0 1 1) will have 0 core mismatches, 1 exon mismatch, and 2 intron mismatch.
The column next to 'In' indicates whether extrapolation has been applied for this allele, this is explained in more detail in the Overview screen section.
An orange box shows that at least one of the mismatches is in the extrapolated data.
By clicking on an allele name (blue letters), you will jump to the analysis screen where the allele will then be shown as reference allele.
By using the right mouse button, a pop-up screen will be opened, presenting all positions where the allele does not match to the data:
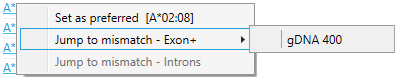
By clicking on a position in the list, you will jump to the analysis screen, where the allele will be shown as reference and the position of interest will be indicated by a triangle.
Jump to mismatch - Exon+.
Jump to mismatch - Introns.
The different triangles are explained here.
For each allele also the CWD, Serology, P group and G group info can be shown:
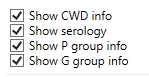
- Show CWD info: show the Common and Well-Documented Alleles information (CWD info) in the genotype ranking. Please note: this info can only be shown when the CWD list has been applied during the analysis. For more info, see Preferences. The CWD information included in NGSengine is derived from the CWD Catalogue: https://www.uvm.edu/~igdawg/cwd.html.
- Show serology: show serology info for each allele in the genotype ranking. The serology information included in NGSengine is derived from the WMDA Directory: https://hla.alleles.org/pages/wmda/wmda/.
- Show P group info: show P group info for each allele in the genotype ranking.
- Show G group info: show G group info for each allele in the genotype ranking.
The CWD information included in NGSengine is derived from the CWD Catalogue: https://www.uvm.edu/~igdawg/pubs/cwd200.pdf and the serology information is derived from the WMDA Directory: https://hla.alleles.org/pages/wmda/wmda/.