Data Analysis
- After the qPCR run, export the results as a .txt or .csv file. When using the Viia7 or Quant Studio it is important to export the results only.
- In KMRengine, click "Import results" to import the qPCR data. Select the correct file.
- KMRengine will perform quality analysis on the data and present the data in the plate view.
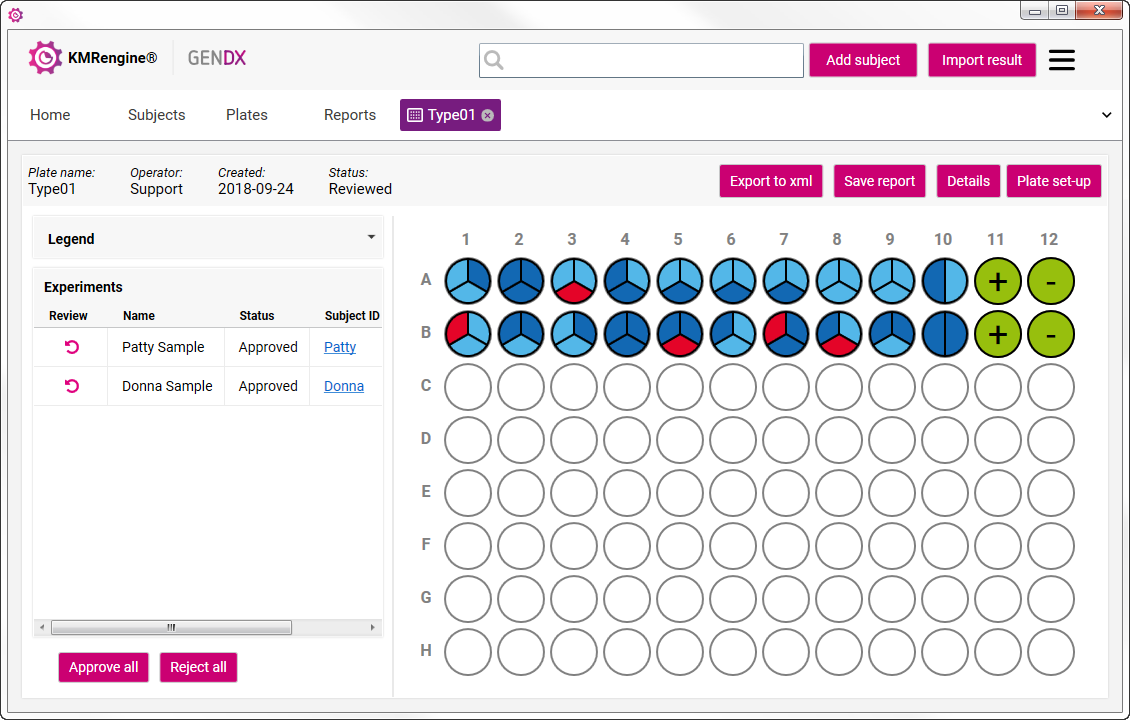
- There are three quality scores given to genotyping data: 1) positive, 2) negative and 3) atypical. These values are represented in the plate image by three different colors
 :
:
- Dark blue: data scored as truly positive.
- Light blue: data scored as truly negative.
- Red: data scored as atypical. Atypical assay results will exclude the assay from being considered as a potential informative assay for all samples grouped in the analysis.
- The control samples of the recipient (+) and the donor (-) are shown in green when the result is valid.
- The sections in the trisected well represent the data from the three qPCR reactions in that well. The three sections of the well are labeled clockwise.
- The upper right section is the first result, the bottom section is the second result and the upper left section is the third result reported from the well.
- Review the data and approve or reject the result:
 Approve the result for this sample
 Reject the result for this sample
 Undo review
Via the "Approve all" or "Reject all" buttons, all samples can be approved or rejected simultaneously.
- Click "Save Report" to obtain the genotyping report.
- Click "Export to xml" to export an xml file for this experiment.
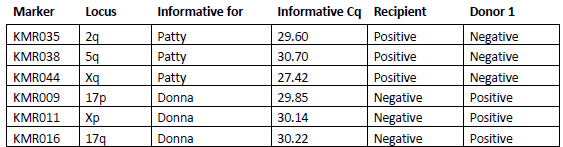
- The report displays which markers are positive or negative for the donor(s) and recipient, and which markers are informative.