Start automated analysis
Start Automated Analysis
“Start Automated Analysis” can be used to initiate data analysis immediately after a Next-Generation Sequencing (NGS) run is completed. The option “Start automated analysis” enables NGSengine to monitor a specified folder for the presence of newly generated NGS data.
NGSengine will initiate data analysis when a file or folder is no longer changing (e.g. a sequence run completed, and all sequence data is saved). Users can specify how long a file should not have been changed (waiting time) before data analysis is initiated. Automated analysis will produce a regular NGSengine project in which all samples are analyzed. Typing results can be reviewed and processed as usual.
To start automated analysis, click the right most button in the welcome page:
In case a project is opened in NGSengine; make sure to close the project through “File” -> “Close project” in order to reach the welcome page.

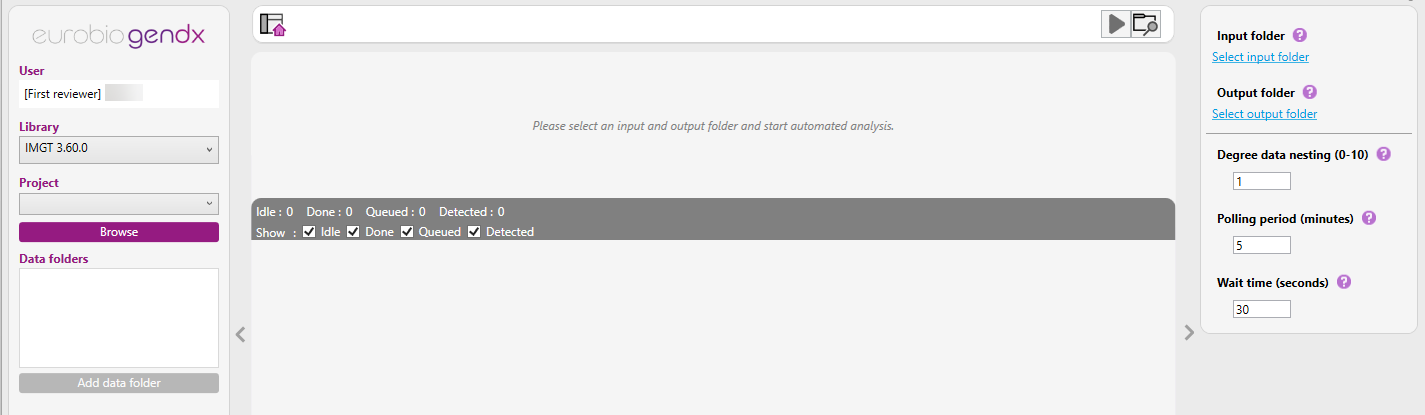
In the screenshot below you can see the automated analysis view.
The panel on the right side displays the monitoring settings. The bar at the top displays actions that require user input to start the analysis. In addition, it will show the progress of the project that is analyzing. The grid below shows the current status of initiated jobs. The status can be detected, queued, idle, done or errored.
To ensure successful execution of the automated analysis, please adhere to the following guidelines:
- The Automated Analysis view must remain open for the automated analysis and monitoring functionality to work. NGSengine may be minimized, but should not be closed.
- Analysis is performed locally, and a user must remain logged in for the duration of the process.
- A separate instance of NGSengine should be launched if a user intends to view or work on another NGSengine project. The functionality to start or open a project is disabled in NGSengine instances running Automated Analysis.
- Before starting the Automated Analysis, select your preferred settings and preferences to be applied during the analysis of the data.
Automated analysis settings:
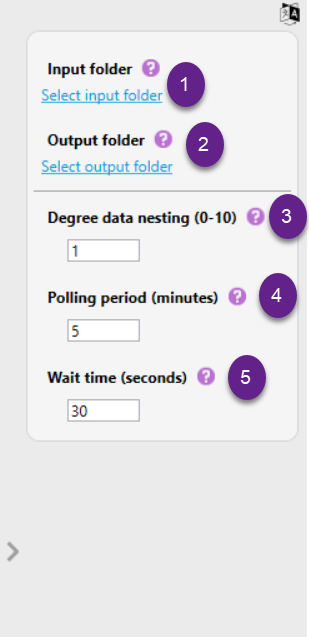
It is possible to modify the following settings in the automated analysis:
1) Input folder: Select the folder that needs to be monitored for the presence of newly generated data. Click "Select Input Folder", to browse and select the appropriate directory.
2) Output folder: Select a folder that will serve as output folder. Project folders created via the automated analysis process will be saved in this folder. Click "Select Output Folder", to browse and select the appropriate directory.
3) Degree data nesting: This setting defines how many folder levels above a detected data folder should be included when grouping data into a single project.
When the software identifies a folder containing data files (e.g., FASTQ), it uses the degree of nesting to determine how far up the folder structure to go when assigning the project folder. (Allowed range: 0–10)
Example:
Suppose your FASTQ files are located in the following path:
/data/ONT_Run_2025/analysis/barcode01/fastq_pass/
- Monitoring folder is set to: /data
- Nesting level 0 → Project folder = fastq_pass
- NGSengine projects will be created for every fastq_pass folder.
- Nesting level 1 → Project folder = barcode01 (grouping per-sample)
- NGSengine projects will be created for every sample.
- fastq_pass files are grouped within a sample.
- Nesting level 2 → Project folder = analysis (groups all samples/barcodes.)
- NGSengine projects will be created containing a group of samples.
- Nesting level 3 → Project folder = ONT_Run_2025 (entire run as one project)
- NGSengine project will be created containing all samples.
It is important to note that the nesting level must not be set at the root monitoring folder. For example, in the case above, setting the nesting level to 4 (i.e., /data) is not allowed. Additionally, if the data in a folder (such as ONT_Run_2025) have been processed and used to create a project, this folder will no longer be monitored.
4) Polling period (minutes): The Polling Period is the frequency at which the system checks the input folder for new files or data. This value must be at least 5 and at maximum 30.000 minutes. This ensures that any newly created or added files are detected and can be processed in a timely manner.
Example:
If the polling period is set to 5 minutes, the system will scan the input folder every 5 minutes to see if any new data has arrived.
5) Wait time (seconds): Wait Time refers to the duration (in seconds) that the system pauses after detecting a new file or folder before starting any processing. This delay ensures that NGSengine does not start processing data while files are still being written to the designated folder. In other words, when a new data folder or file is detected, the system pauses for the duration specified. After this wait period, processing starts automatically.
Example:
If a file is detected by the system at 10:00 and the Wait Time is set to 180 seconds, the system will begin processing at 10:03. This buffer helps ensure that the data—such as output from an Illumina sequencer device—is saved in the datafolder before analysis is started.
Starting the automated analysis:
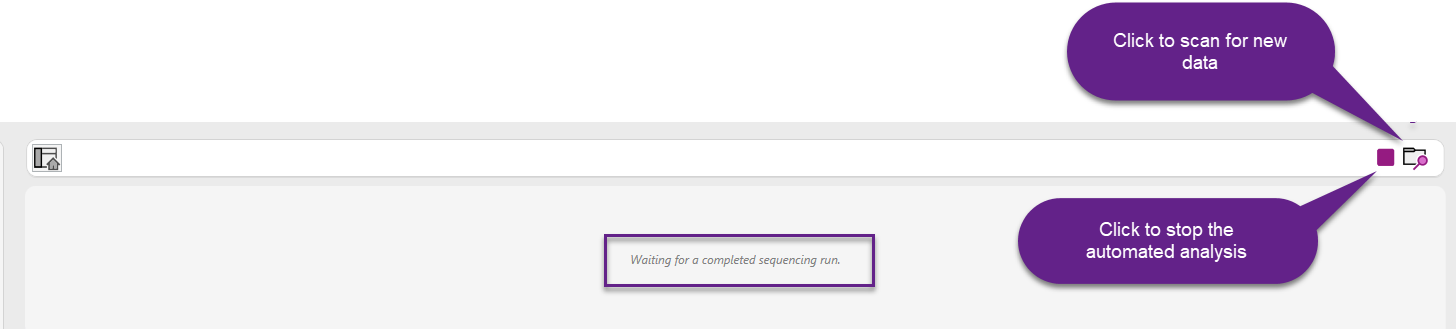
Once all preference settings have been configured, you can start the Automated Analysis by clicking the start button in the bar at the top:
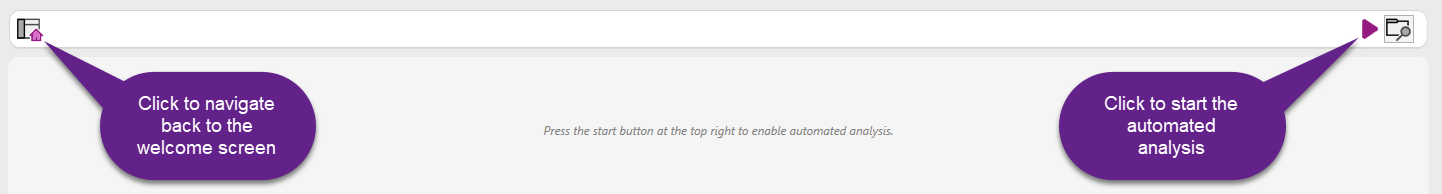
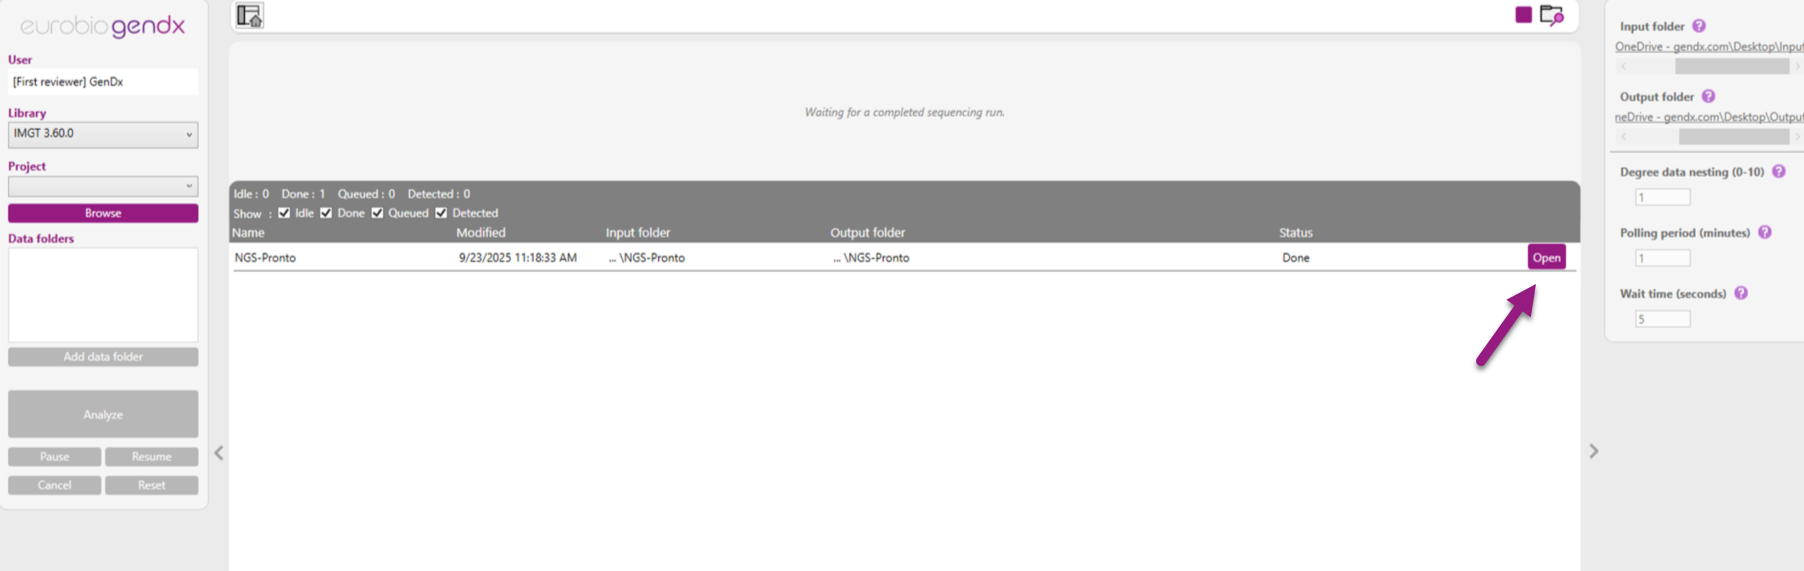
After clicking the Start button, Automated Analysis is enabled, and the software will display the message: "Waiting for a completed sequencing run."
During this phase, it is also possible to click the scan folder icon to manually scan the input folders for the presence of new data.
If a new data folder is detected, a job will be created with status “Detected”. This means that the software has recognized a file that is valid for further processing. After detection, the file enters the analysis pipeline. The green progress bar shows how much of the analysis is complete.
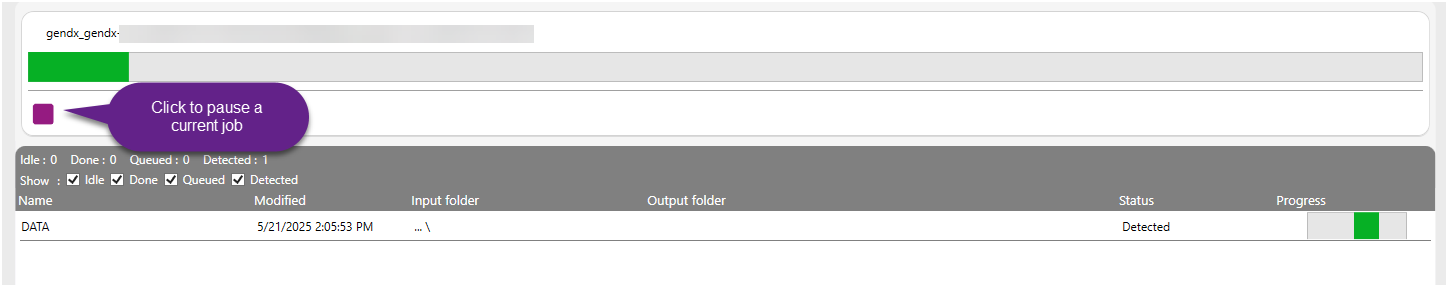
The file was recognized and is ready for analysis or currently being analyzed.
Idle: Lists files waiting with no active processing
Queued: Jobs lined up to start
Done: All fully processed jobs.
Errored: Jobs that failed due to issues like corrupted data, incorrect formats, or system interruptions.
The software displays the number of jobs in each stage of the analysis process. These counts are shown at the top of the job summary panel, allowing users to monitor the current status of all active and completed analysis. The information shown in the grid is listed based on the "Modified" timestamp, which is updated with every status change of the job. When all the analysis steps are successfully completed, the job status is updated to "Done". This confirms that the analysis has been fully processed and no issues were encountered, meaning the output project is ready for review.
If an error occurs during processing, the software adds an Error label to the panel and increases the count to indicate how many jobs have failed. An error status will also appear if the analysis is interrupted by clicking the Pause/Cancel button next to the running job. In such cases, the job is marked as Errored, as not all samples were successfully analyzed.
When the automated analysis is complete, it is possible to open the analyzed project by clicking on the "open" icon.